

Latino College Completion -
North Dakota
Nationally, the gap in degree completion between Latinos and their White peers continues. To make our country stronger and meet the economy’s demand for a highly educated workforce, we must ensure access to quality higher education for Latino, and all, students. This requires accelerating Latino degree completion, increasing completion for all students, and scaling programs and initiatives proven to support Latino, and all, student success. The following demographics, institutional data, and practices inform Latino degree attainment.
To find out more, scroll below.
Degree Attainment for Latino Students (2026)
34%
Of Latino adults (25 and over) had earned an associate degree or higher
VS
49%
Of White adults

Fast Facts
North Dakota had the 47th largest Latino population in the U.S.
Latino Population
7%
K-12 Population
5%
Total Population
Enrollment
14%
Latino Students
26%
White Students
Median Age
22
Latinos
39
White
Median Income
$40,777
Without a college degree
$62,419
With a college degree
Degree Outcomes
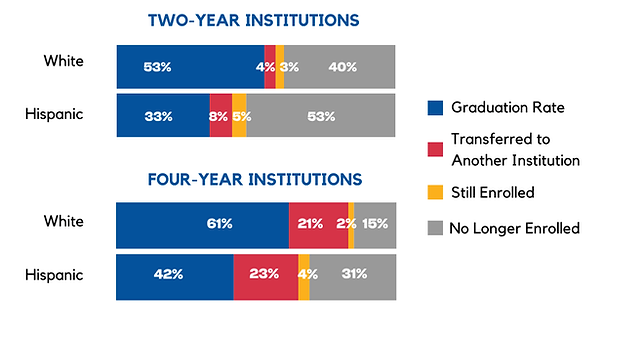
At two-year institutions, Hispanics' graduation rate was 20%-points lower than that of their White non-Hispanic peers in North Dakota.
At four-year institutions, Hispanics' graduation rate was 19%-points lower than that of their White non-Hispanic peers in North Dakota.
Top Institutions Enrolling and Graduating Hispanic Undergraduates, 2026
Rank | Institution Name | Sector | Total Enrollment | Hispanic Enrollment | % Hispanic Enrollment | Total Completions | Hispanic Completions | % Hispanic Completions |
|---|---|---|---|---|---|---|---|---|
1 | University of North Dakota | Public, 4-year or above | 9,296 | 532 | 6% | 1,859 | 78 | 4% |
2 | North Dakota State University-Main Campus | Public, 4-year or above | 9,567 | 293 | 3% | 2,131 | 63 | 3% |
3 | Minot State University | Public, 4-year or above | 2,072 | 197 | 10% | 489 | 39 | 8% |
4 | Bismarck State College | Public, 4-year or above | 2,629 | 148 | 6% | 670 | 28 | 4% |
5 | Williston State College | Public, 2-year | 686 | 133 | 19% | 240 | 25 | 10% |
Examples of What Works for Latino, And All, Students
Looking to know what works or connect with evidence-based programs recognized by Excelencia?
Our team can work with you to identify and connect with relevant programs making an impact on student success that can help you in your efforts to intentionally serve your Latino, and all, students.
Sources
U.S. Census Bureau, 2023 American Community Survey 1-Year Estimates.
Excelencia in Education analysis using U.S. Department of Education, National Center for Education Statistics (NCES), Integrated Postsecondary Education Data System (IPEDS), 2023 Fall Enrollment, Graduation Rates Survey, and Institutional Characteristics Survey.